Seven views of the same project.
Because "on track" means different things depending on what you're managing right now. Switch views without switching tools.
Gantt - Timeline planning
Drag-and-drop timeline view of all activities. Dependencies, delays and overlaps visible at a glance. Updates when the logframe changes.
Auto-generated from logframe activities - no copy-pasting
Drag to reschedule; TriPulse™ recalculates in real time
Colour-coded by status: on track / delayed / at risk
metriqos.net · DIP · Gantt View

Kanban - Workflow boards
Move activities across stages: To Do → In Progress → Under Review → Complete. Assign owners, set due dates, track blockers.
Activity cards carry budget and indicator linkage
Comments on cards create audit-trail notes
Filter by responsible team member or output
metriqos.net · DIP · Kanban View
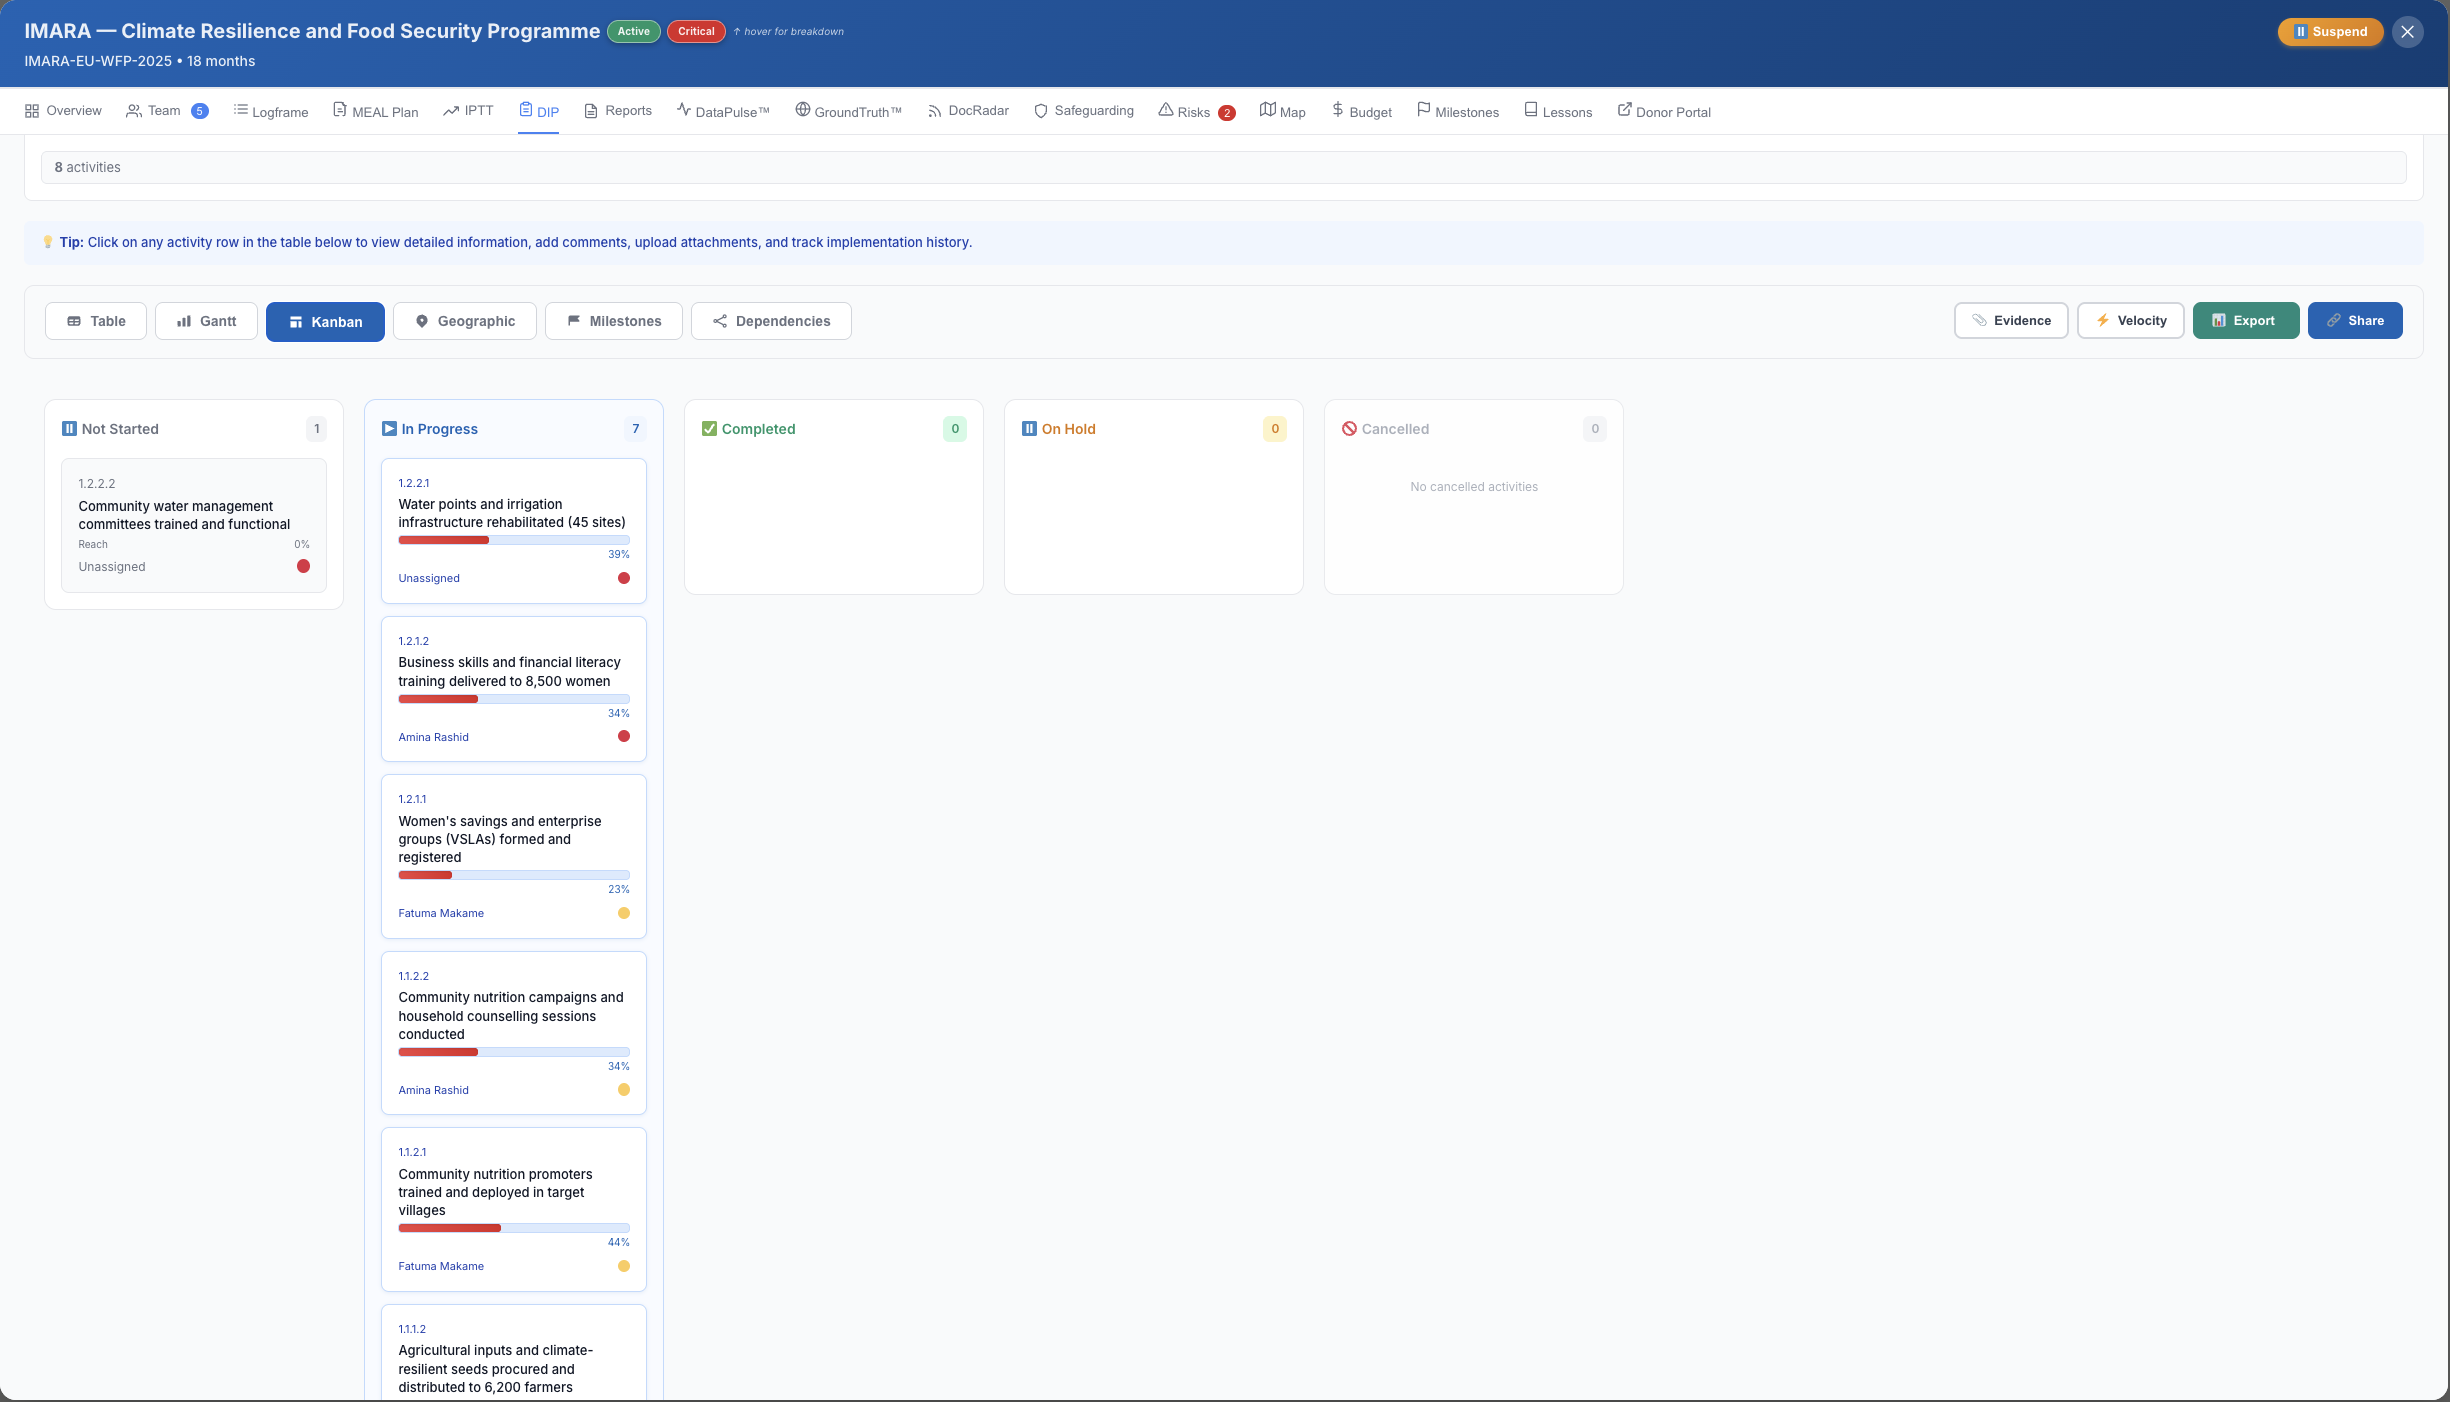
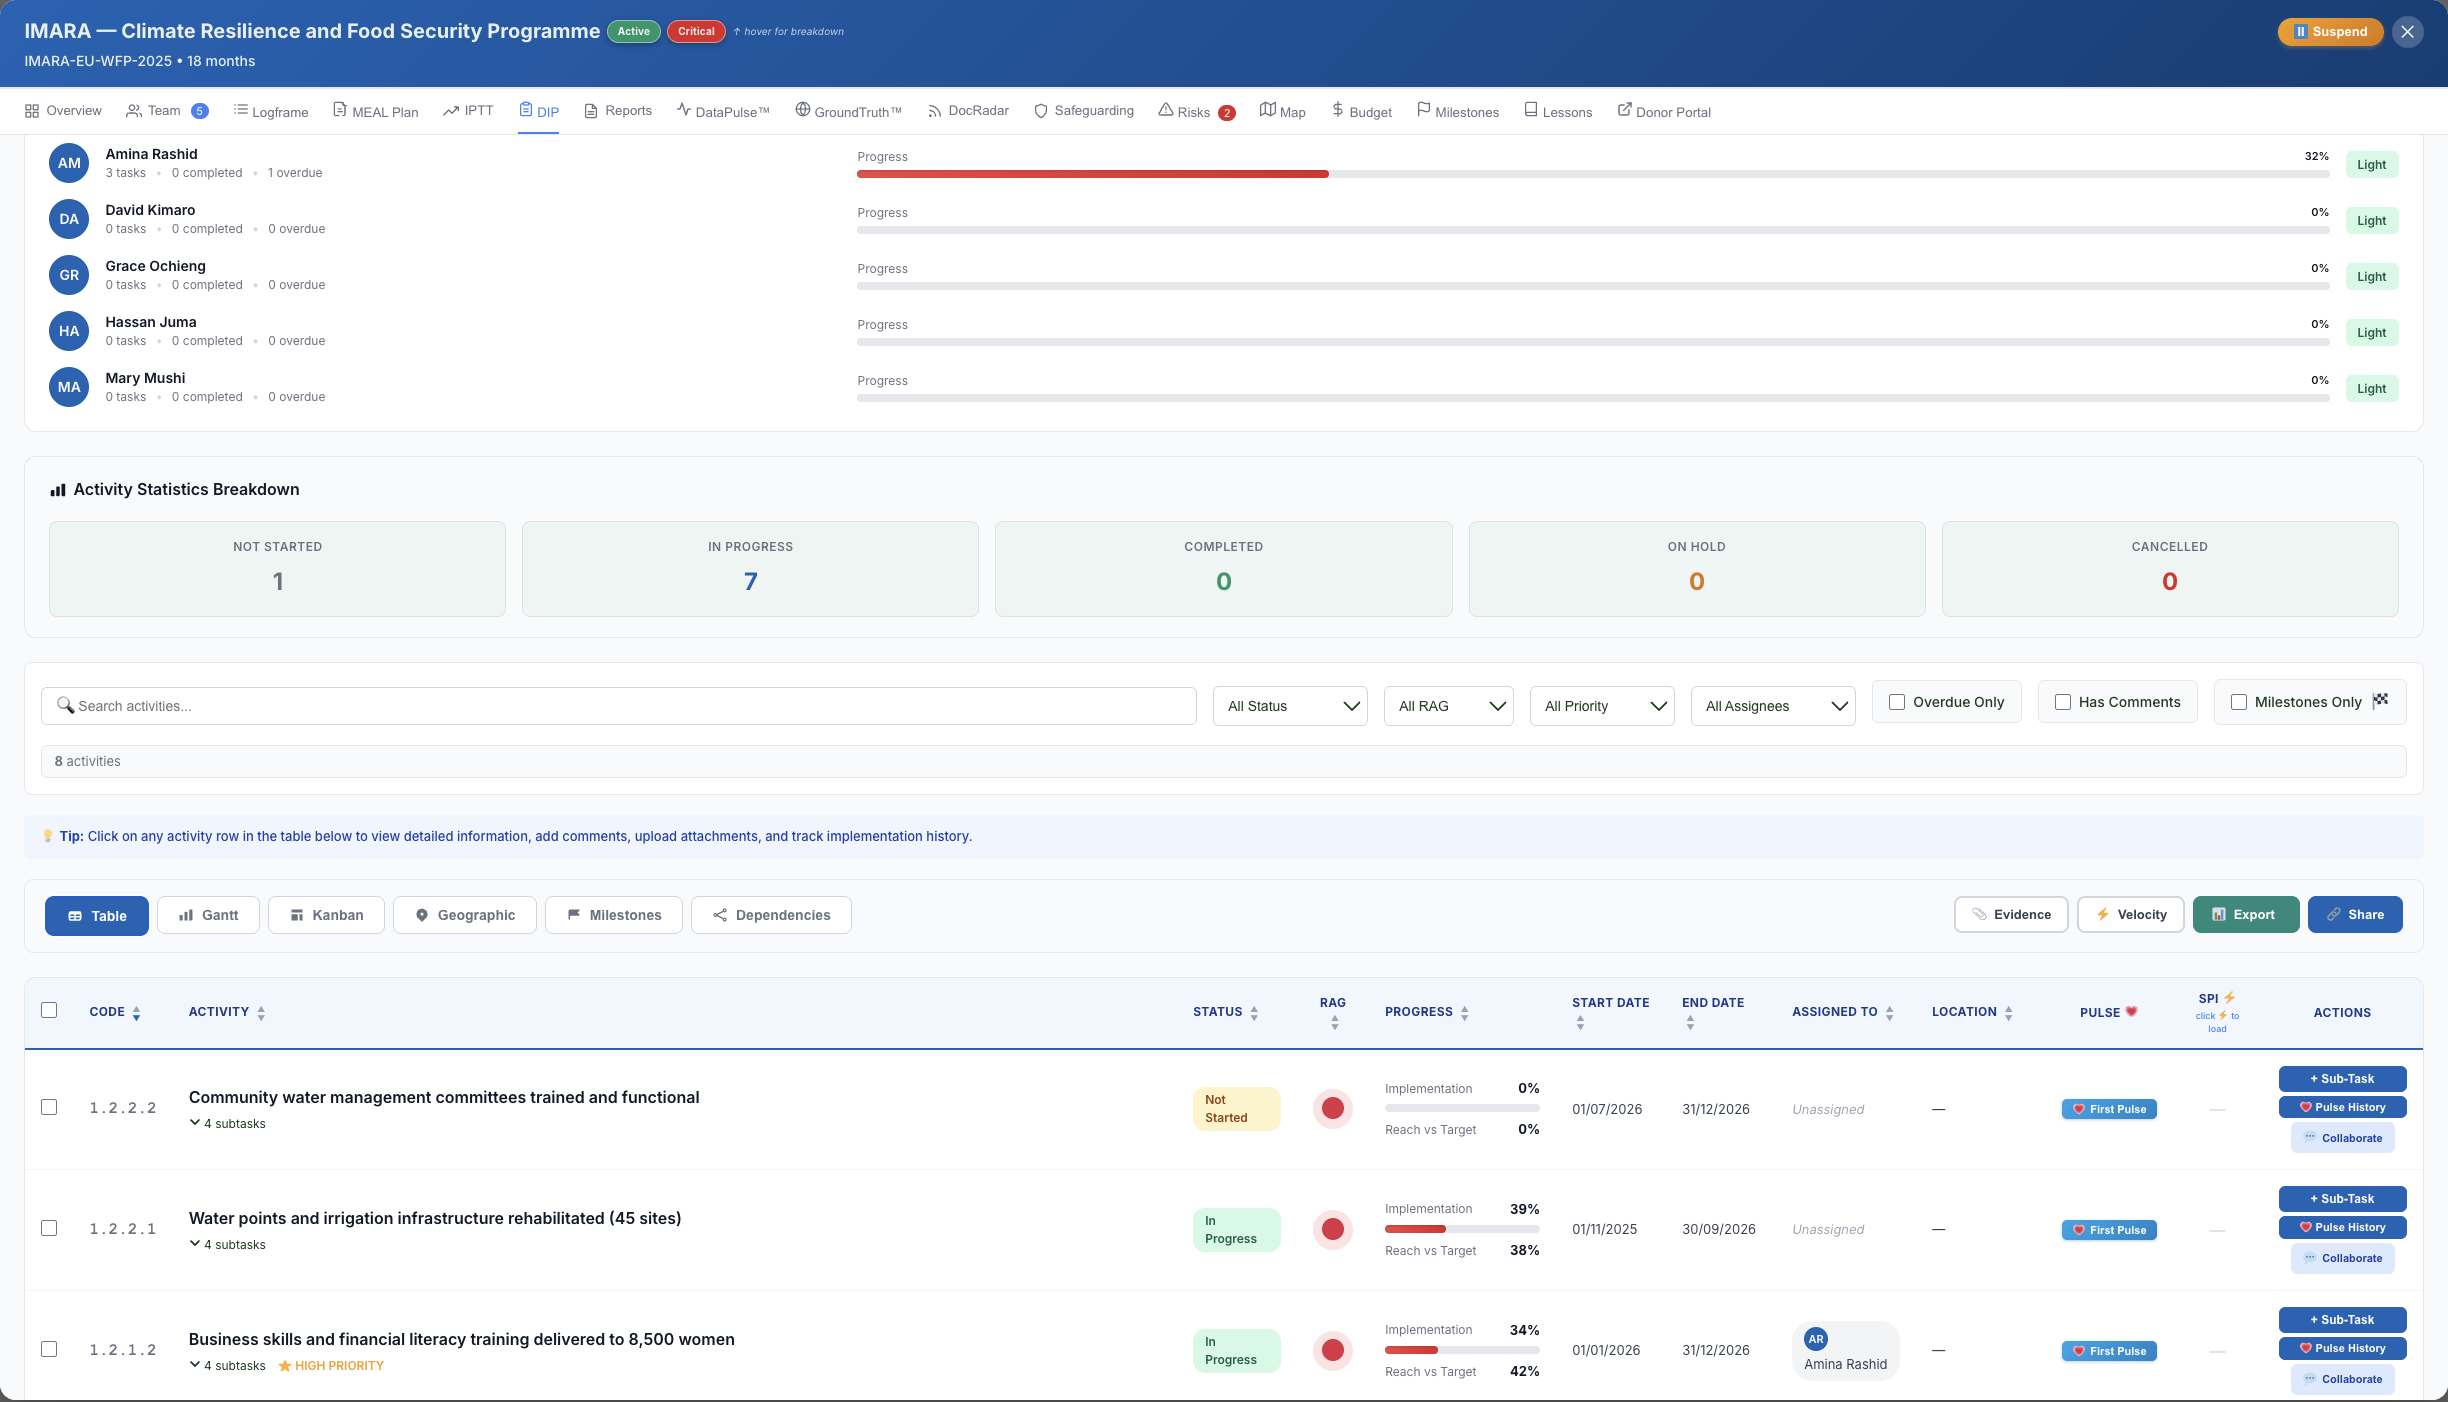
Table - Structured data entry
Spreadsheet-like rows for every activity. Bulk-edit start dates, budgets, outputs and key activities. Best for reporting periods.
Export-ready format matching donor reporting templates
Inline editing - no modal pop-ups
Sort and filter by output, responsible unit, or status
metriqos.net · DIP · Table View
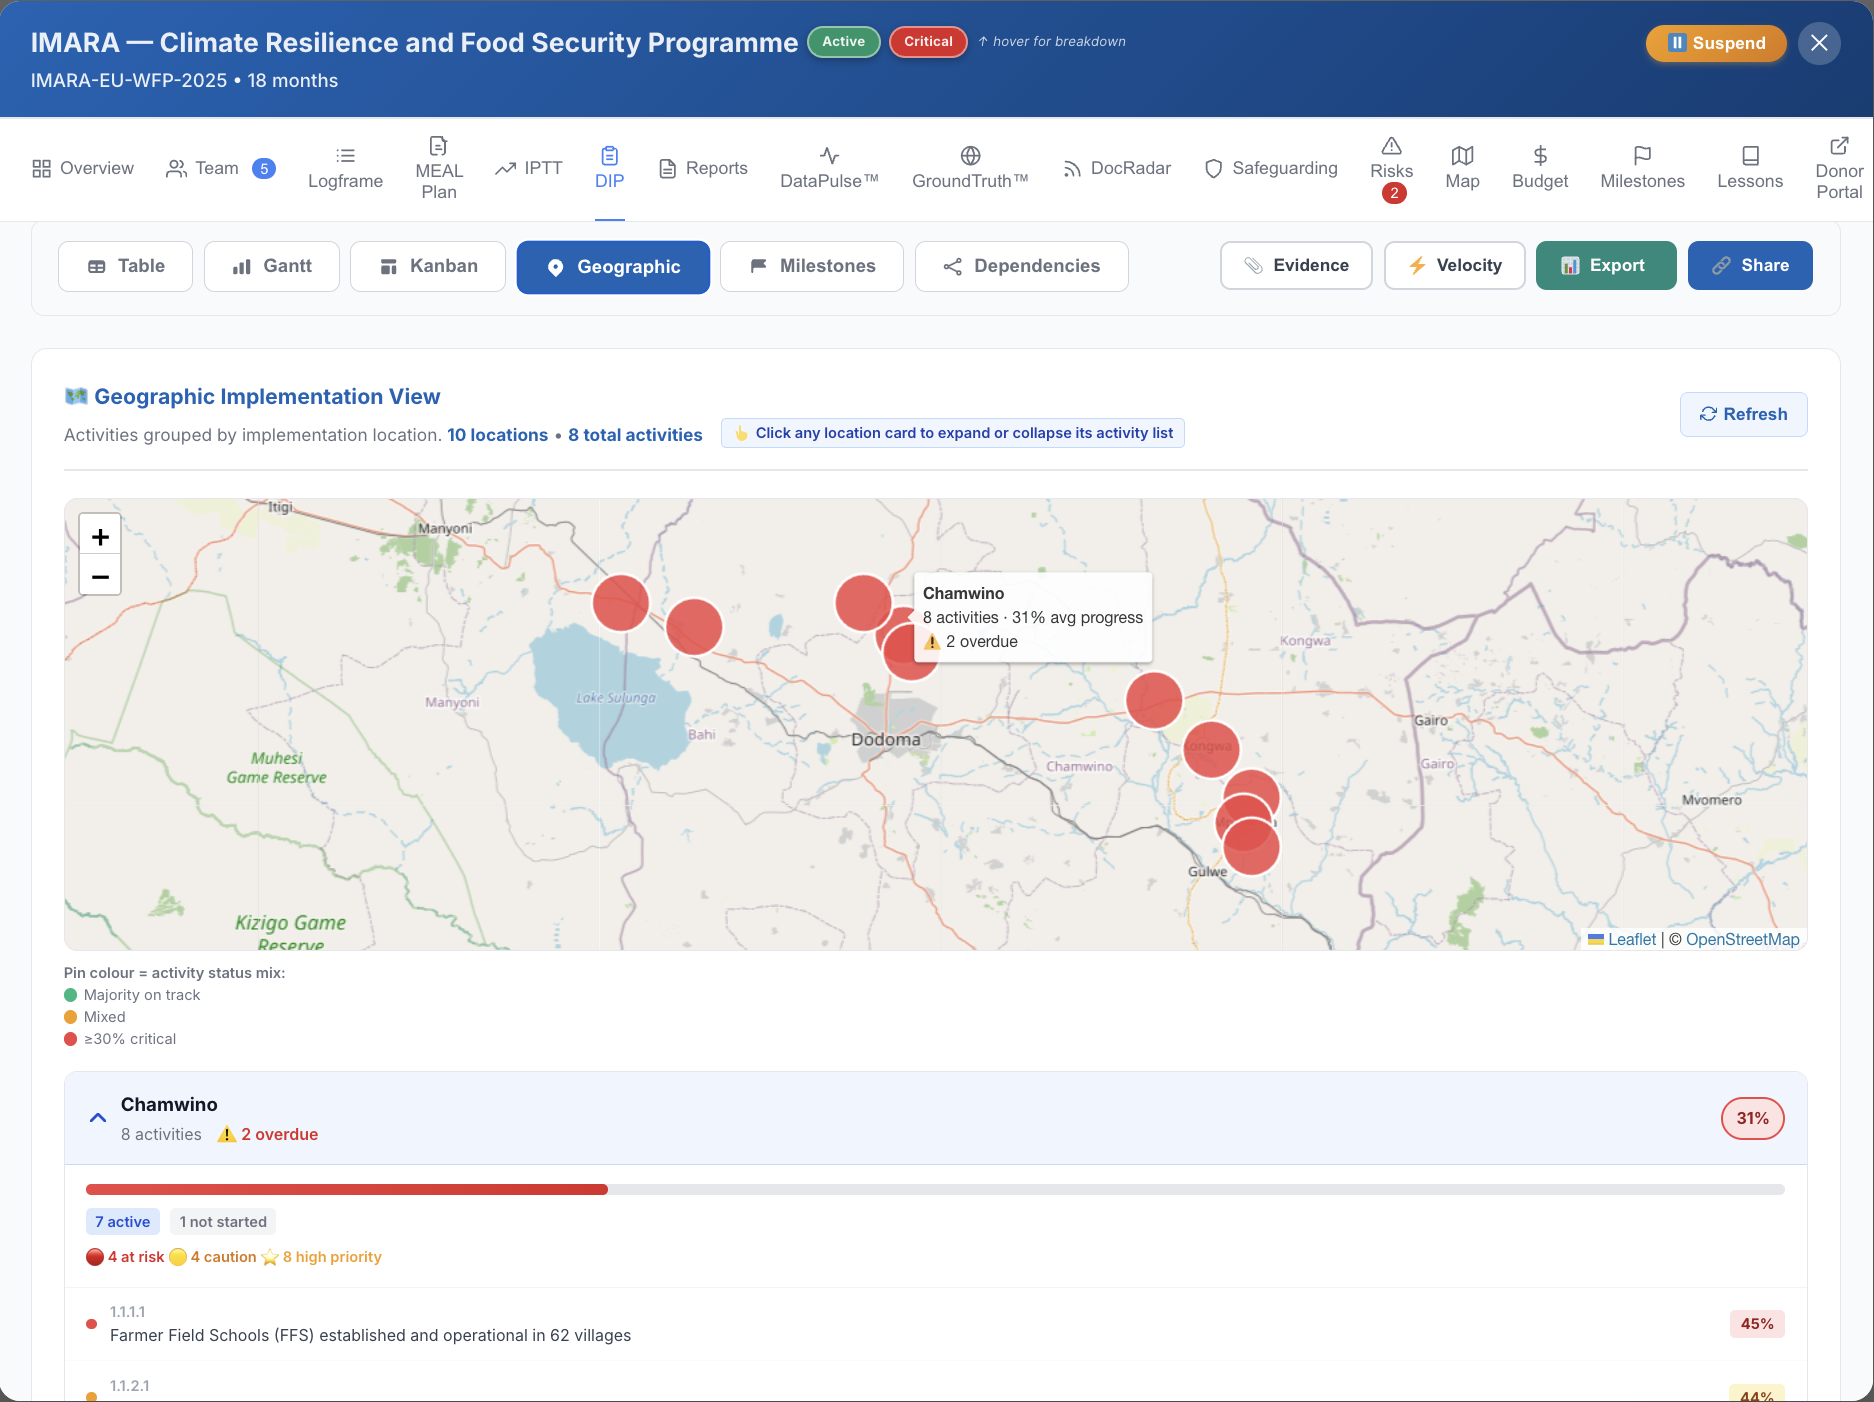
Geographic - Map view
Plot activities and field data collection sites on a map. Visualise beneficiary coverage by district, region or country.
GPS coordinates from GroundTruth sync automatically
Filter by indicator or output to see geographic reach
Exportable as a PNG for donor reports
metriqos.net · DIP · Geographic View
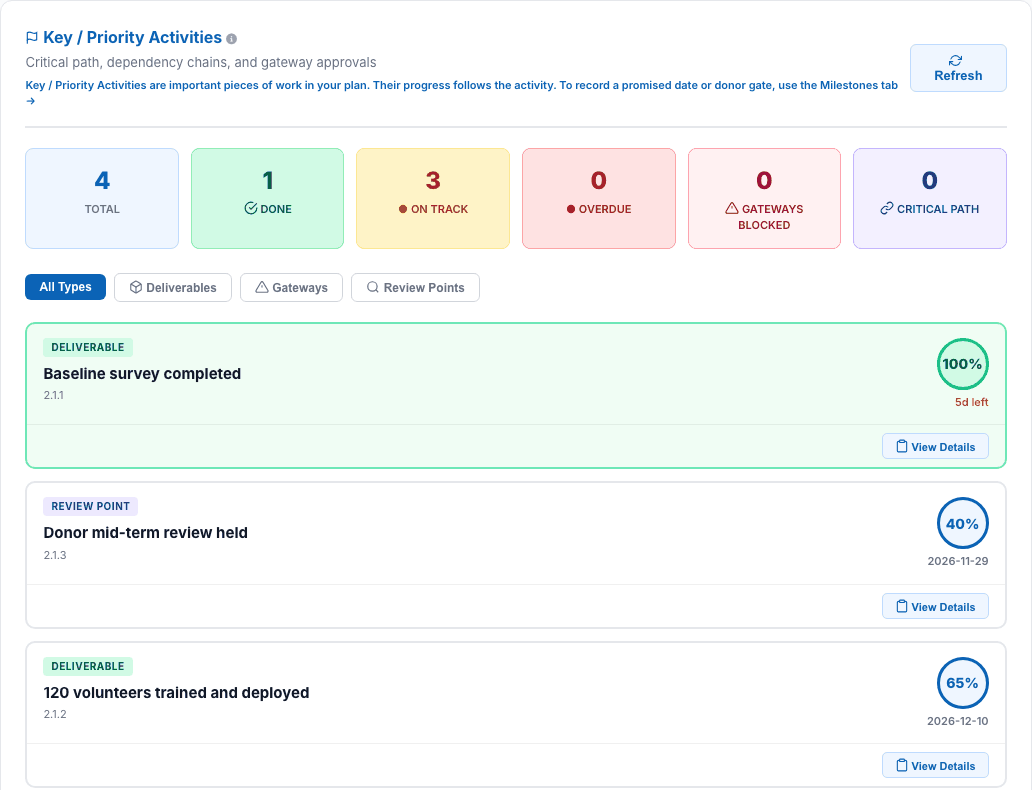
Key Activities - What matters most
Strip away the detail. See only the activities you marked as Key / Priority Activities - contractual deliverables, decision points, important reviews. Dated commitments such as donor deadlines are tracked separately as Milestones.
Mark any activity as a Key / Priority Activity
Automated reminders 7 and 2 days before each deadline
Donors can see key activity progress in the Donor Portal
metriqos.net · DIP · Key Activities View
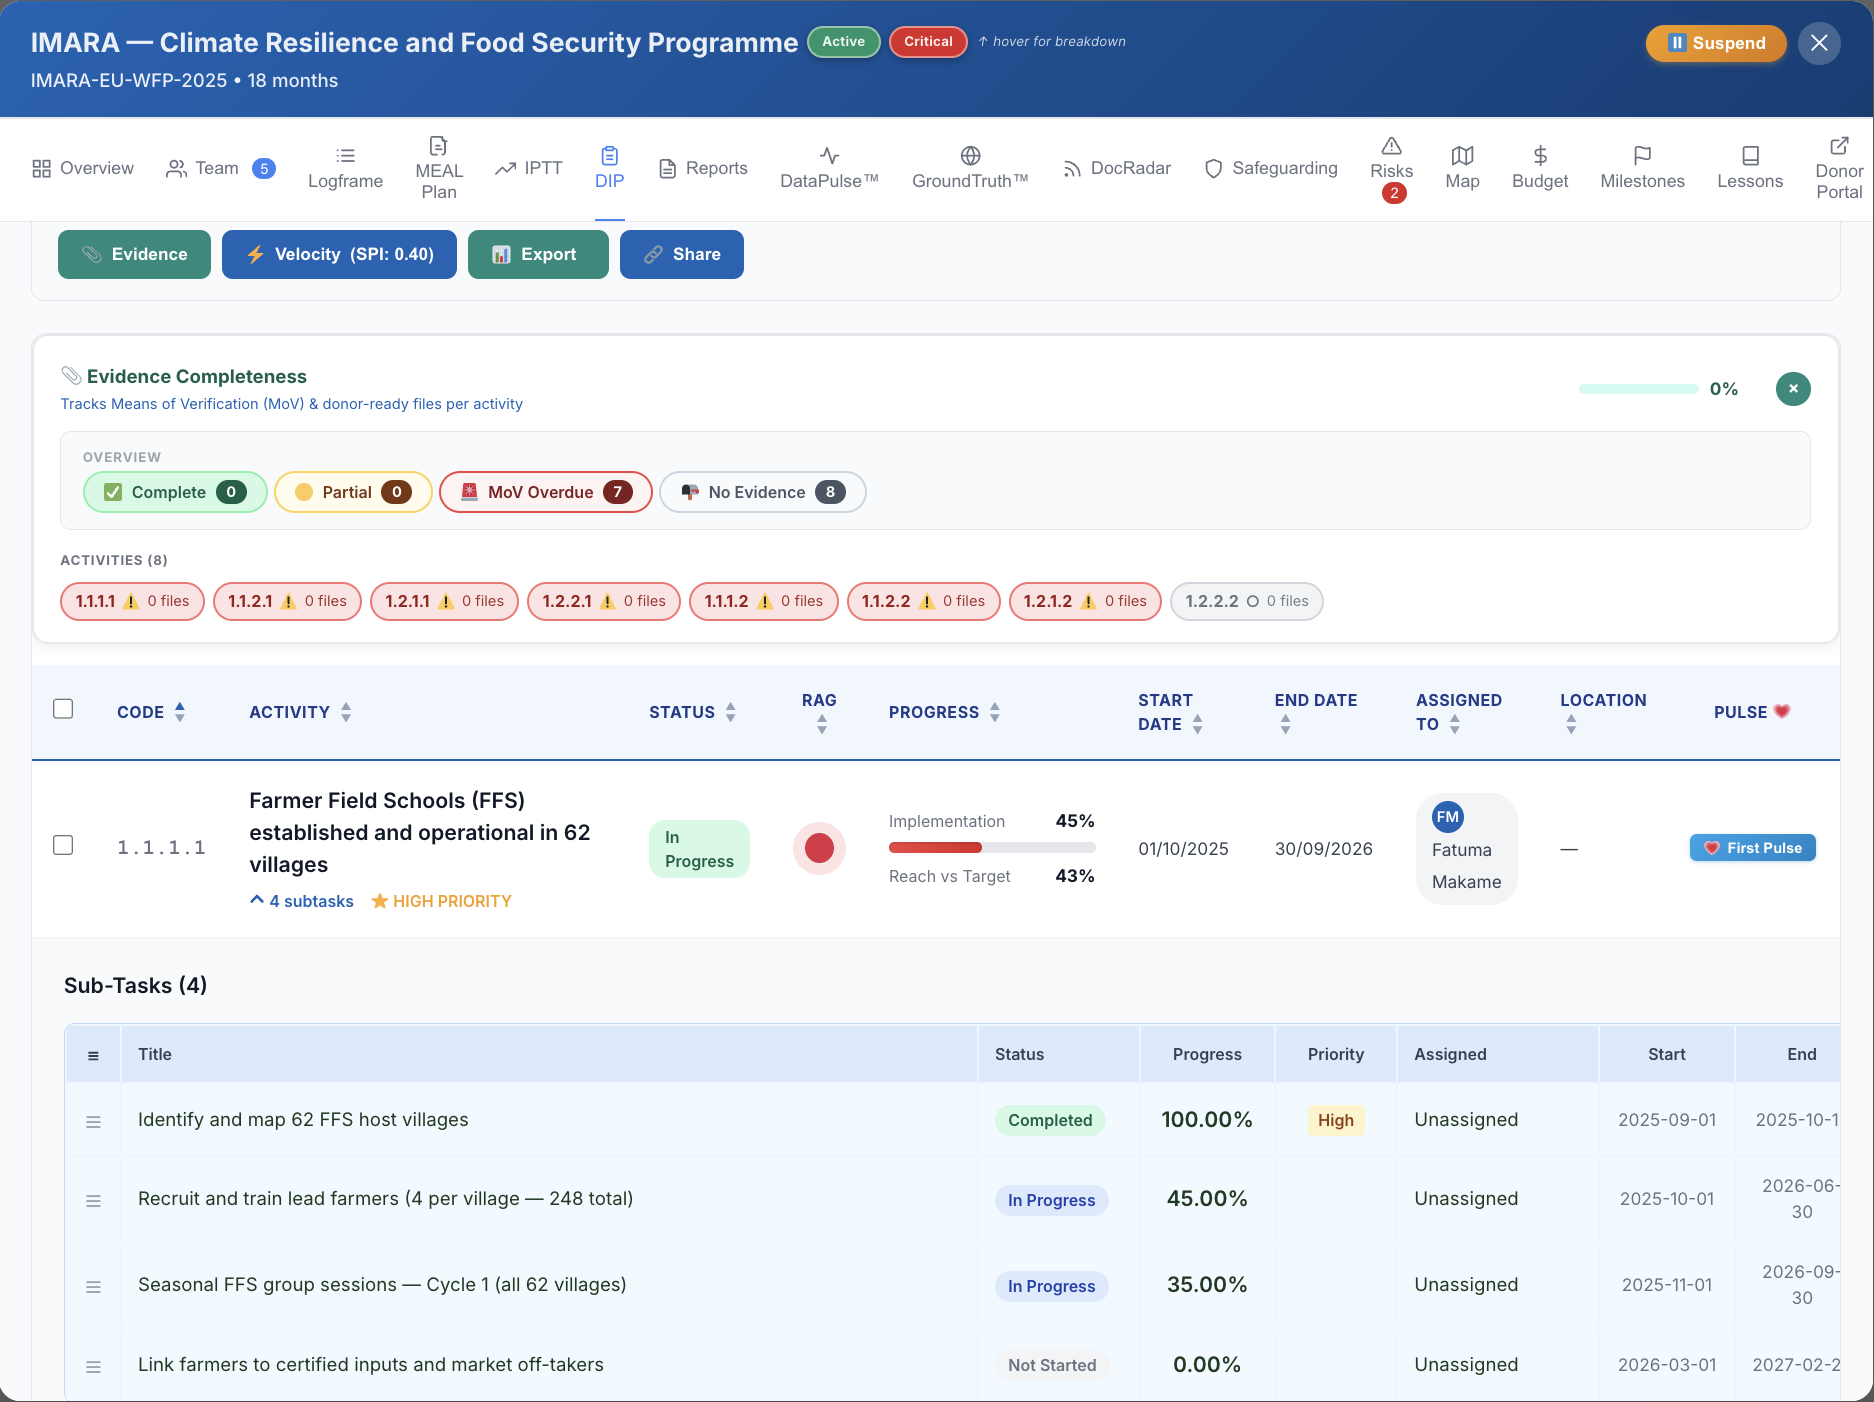
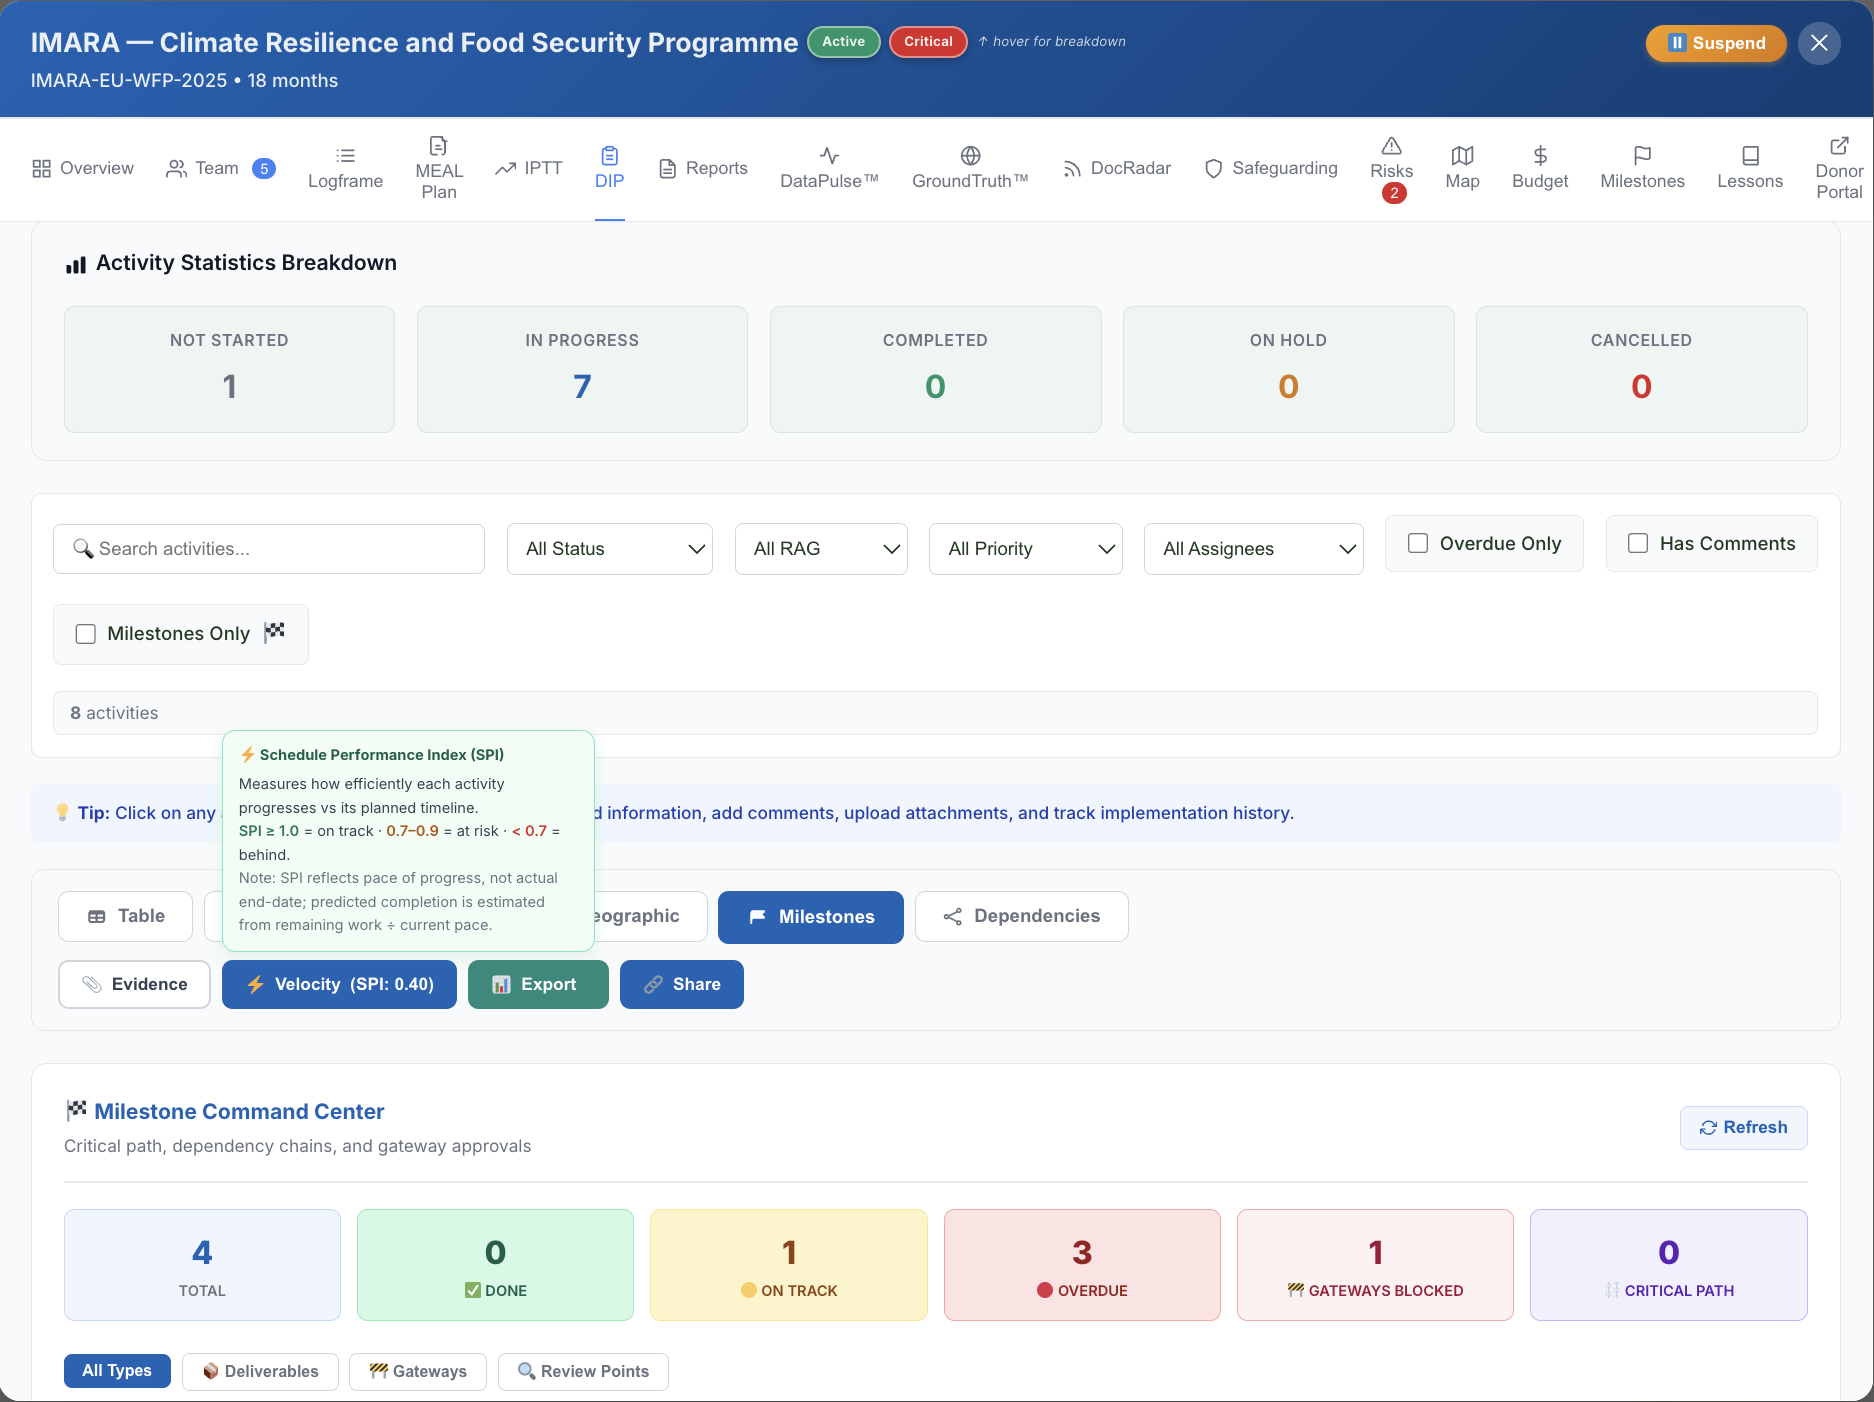
Velocity - Activity completion rate
Track how fast activities are closing vs. how fast they should be. Velocity drops before the quarterly report catches a delay - visible here.
Running average of weekly completion rate
Projected completion date based on current velocity
Feeds directly into TriPulse™ time-elapsed axis
metriqos.net · DIP · Velocity View
Evidence - MoV linkage
Every activity linked to its Means of Verification. DocRadar tracks MoV coverage and flags gaps - before the donor asks for them.
MoV coverage percentage per output and indicator
Attach documents, field photos, and reports directly
Feeds into DataPulse™ Evidence Density score
metriqos.net · DIP · Evidence View